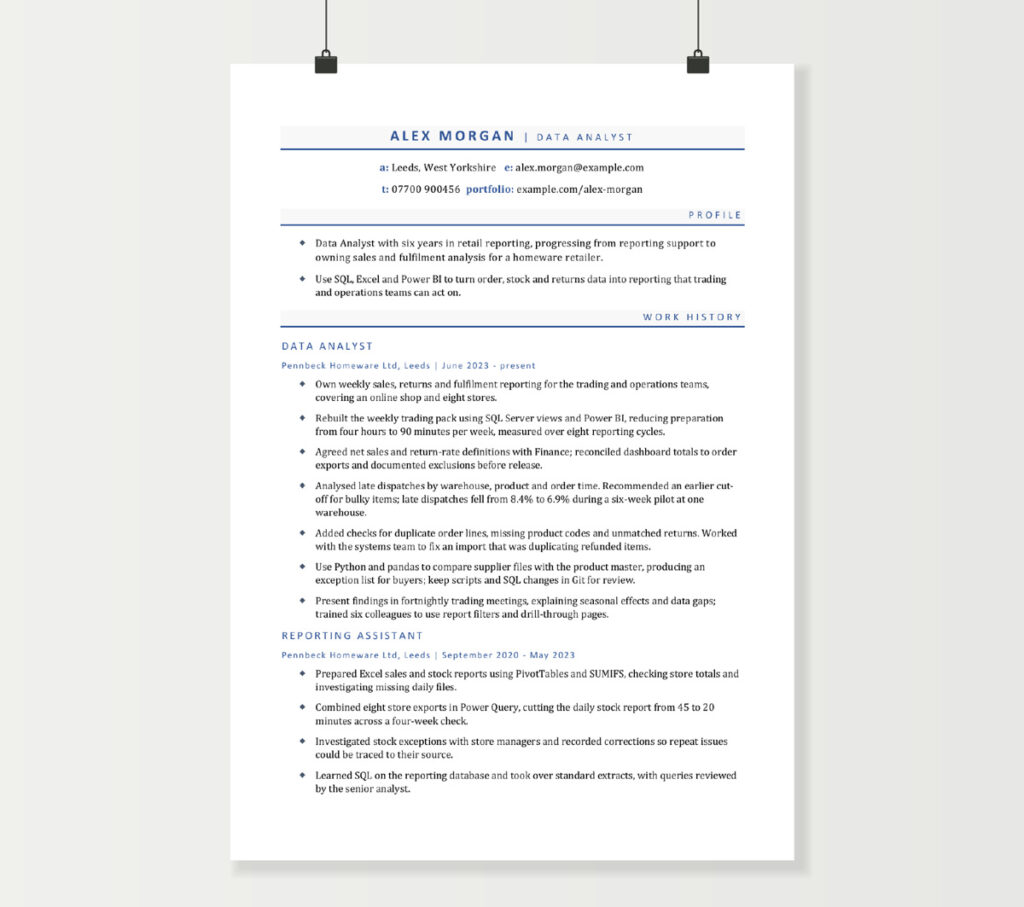
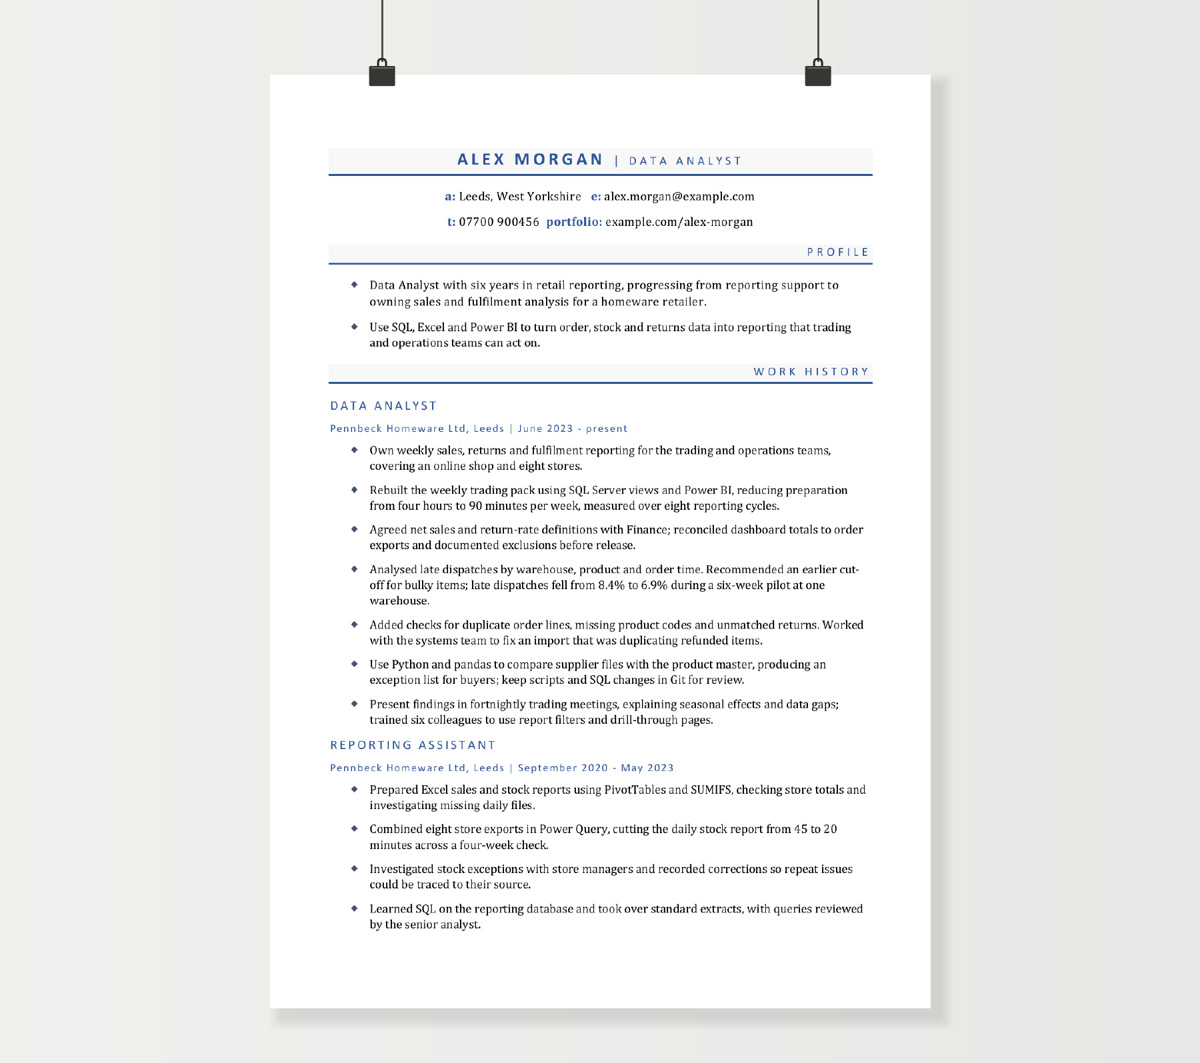
This free Data Analyst CV template contains a complete UK example for an analyst working with SQL, Excel and Power BI. It follows a fictional candidate’s progression from Reporting Assistant to Data Analyst, showing how to describe reliable reporting, data-quality checks and analysis that helps colleagues make decisions.
The two-page Word document is fully editable and suits applicants with reporting or analytical experience, including those moving from an MI or reporting role. The guide also explains how graduates and career changers can use projects to demonstrate their ability. Use the example’s level of detail as a guide, then replace the content with your own experience.
Filename: FreeCVDownload_Data_Analyst.docx
Word format · Two pages · Fully editable
Alex Morgan and Pennbeck Homeware Ltd are fictional. The contact details, portfolio address and achievements are illustrative; replace them before applying. This template includes the original FreeCVDownload copyright text box.
Content of this CV template
Alex Morgan | Data Analyst
a: Leeds, West Yorkshire e: [email protected]
t: 07700 900456 portfolio: example.com/alex-morgan
Profile
- Data Analyst with six years in retail reporting, progressing from reporting support to owning sales and fulfilment analysis for a homeware retailer.
- Use SQL, Excel and Power BI to turn order, stock and returns data into reporting that trading and operations teams can act on.
Work history
Data Analyst
Pennbeck Homeware Ltd, Leeds | June 2023 – present
- Own weekly sales, returns and fulfilment reporting for the trading and operations teams, covering an online shop and eight stores.
- Rebuilt the weekly trading pack using SQL Server views and Power BI, reducing preparation from four hours to 90 minutes per week, measured over eight reporting cycles.
- Agreed net sales and return-rate definitions with Finance; reconciled dashboard totals to order exports and documented exclusions before release.
- Analysed late dispatches by warehouse, product and order time. Recommended an earlier cut-off for bulky items; late dispatches fell from 8.4% to 6.9% during a six-week pilot at one warehouse.
- Added checks for duplicate order lines, missing product codes and unmatched returns. Worked with the systems team to fix an import that was duplicating refunded items.
- Use Python and pandas to compare supplier files with the product master, producing an exception list for buyers; keep scripts and SQL changes in Git for review.
- Present findings in fortnightly trading meetings, explaining seasonal effects and data gaps; trained six colleagues to use report filters and drill-through pages.
Reporting Assistant
Pennbeck Homeware Ltd, Leeds | September 2020 – May 2023
- Prepared Excel sales and stock reports using PivotTables and SUMIFS, checking store totals and investigating missing daily files.
- Combined eight store exports in Power Query, cutting the daily stock report from 45 to 20 minutes across a four-week check.
- Investigated stock exceptions with store managers and recorded corrections so repeat issues could be traced to their source.
- Learned SQL on the reporting database and took over standard extracts, with queries reviewed by the senior analyst.
Qualifications
Microsoft Certified: Power BI Data Analyst Associate
Microsoft | Awarded May 2024; renewed May 2026
BSc Mathematics and Statistics – 2:1
University of Leeds | September 2017 – July 2020
Skills
- SQL Server: joins, CTEs, aggregations and window functions for reporting and reconciliation.
- Excel: PivotTables, XLOOKUP, SUMIFS and Power Query for repeatable data preparation.
- Power BI: star-schema models, DAX measures, drill-through reports and scheduled refresh.
- Python: working knowledge of pandas for file checks and exploratory analysis.
- Data quality: duplicate and null checks, source reconciliation and documented validation rules.
- Analysis: trend and variance analysis, segmentation and comparisons that account for seasonality.
- Stakeholders: agreeing requirements, explaining limitations and recommending next steps.
- Git: versioning SQL and Python files and responding to peer-review comments.
Hobbies and interests
Enjoy walking in the Yorkshire Dales and volunteering at a local repair cafe. Maintain a small personal portfolio using public or synthetic retail data.
How to write a data analyst CV
A useful Data Analyst CV lets an employer follow your work from the question to the decision. What data did you use? How did you check it? What did the analysis show, and what happened next? Those details make a stronger case than a long list of software.
We reviewed recent UK Data Analyst vacancies to identify the skills, tools and evidence employers are currently asking candidates to demonstrate. The sample covered reporting, public-service, product and commercial analytics roles; it is not a statistically representative survey of the UK labour market. The example CV focuses on retail reporting: it is one credible route through the occupation, rather than a checklist of everything an analyst might do.
1. Establish what this particular analyst role needs
Read the responsibilities before choosing your headline skills. A role built around monthly performance reporting needs evidence of dependable refreshes, reconciliations and clear definitions. A product analyst vacancy may put more weight on customer behaviour, funnels and experiments. A finance-focused role may expect forecasting and an understanding of the numbers behind the accounts.
The difference is visible in the vacancies we reviewed. A public-service Data Analyst role emphasised service performance, data validation and reports for different audiences. A senior product analyst role included experimentation and product measurement. Both require communication, but the analytical evidence each CV needs is different.
Make a short working list of the employer’s essential methods, tools and domain knowledge. Match each item to a job, project or qualification you can discuss. Use that to select your evidence, rather than copying the advert into your profile. Do not add machine learning, cloud platforms or a second programming language just because they appear in other analyst vacancies.
2. Make your profile describe your analytical work
Your personal statement should give the reader your level, the type of data you work with and the problems you help solve. In this example, Alex’s six years cover reporting support as well as the later Data Analyst role; the dates make that distinction clear. SQL, Excel and Power BI appear alongside sales, stock and returns because that is where the candidate uses them.
An experienced applicant might mention ownership of a reporting area or an investigation that informed a decision. A new entrant can name a substantial academic, voluntary or independent project instead. For example, if accurate: “Mathematics graduate with a SQL and Power BI project investigating cancellations in retail transaction data. Built reconciliation checks and a report explaining how cancellation treatment changes sales totals.” That describes evidence without implying paid analyst experience.
3. Choose projects that show judgement
Select two or three pieces of work that match the vacancy and demonstrate different decisions. For a reporting role, a well-checked recurring report and an investigation into an operational problem may be more useful than several unrelated prediction models. Put work projects under the job where you completed them. Use a separate Projects section when projects are your main evidence or add a capability your employment history does not show.
For each project, identify the question, source and scope, your contribution, the important checks, and the finding or deliverable. Give enough detail to distinguish your work from a tutorial. In a team project, say which query, model, analysis or presentation you owned.
For example, the UCI Online Retail dataset contains historical UK retail transactions from December 2010 to December 2011 and identifies cancellation invoices. A useful project could examine how cancellations affect reported sales. Explain how you treat cancellations, questionable prices and incomplete periods; do not simply delete inconvenient records. Record your decisions and cite the dataset. This is a suggested project brief, not a claim that the fictional candidate completed it.
A completed independent analysis can demonstrate sound methods without claiming that a real company implemented your recommendation. “Produced a report recommending…” is accurate where “increased revenue…” would not be.
4. Make SQL proficiency visible
Name the database you have used, such as SQL Server or PostgreSQL, and the tasks you can perform independently. Useful evidence includes combining transactional tables, aggregating at the correct level, handling nulls, working with dates and checking the results against a trusted source. List CTEs or window functions when they contributed to your work and you can explain them.
One strong SQL example might describe joining orders and returns while preserving one row per order in the final report. If a single order has several lines and several returns, an unchecked join can multiply the records and inflate totals. Explaining the aggregation and reconciliation you used is more persuasive than “advanced SQL”.
Window functions are useful for tasks such as ranking or comparing rows without collapsing them into a single grouped result; the PostgreSQL tutorial illustrates that distinction. Your CV needs the purpose, not a catalogue of function names. If your experience comes entirely from projects, label it as project experience. Do not imply responsibility for production databases, permissions or performance tuning you have not handled.
5. Give Excel the same attention as newer tools
“Microsoft Office” tells a recruiter little about your analytical ability. Describe the Excel features you use and the work they support: PivotTables for summarising sales, XLOOKUP for matching reference data, SUMIFS for controlled calculations, or Power Query for repeatable imports and transformations.
Alex’s earlier role shows why this matters. Combining eight store exports into a repeatable process is a believable improvement, and the CV gives both the old and new preparation time. The checks still matter: a faster spreadsheet is not an achievement if it silently loses a store’s data.
For finance vacancies, include modelling, forecast comparisons or reconciliation if you have done them. A finance-focused Data Analyst vacancy in our review combined Excel, SQL and Power BI with financial reporting. Do not claim VBA or macros simply to strengthen an Excel entry; Power Query-based automation is useful evidence in its own right.
6. Explain what sits behind your dashboards
For Power BI, distinguish data preparation, modelling, DAX measures, report design and publishing. If you created a star schema, explain the business data it organised. In a star schema, fact tables contain events or observations, while dimensions are used to filter and group them. The relevant CV point is that your model produced consistent, usable analysis.
For Tableau, you might describe data relationships, calculated fields, filters, dashboard actions and publishing. For Looker, distinguish writing or maintaining LookML from using an existing dashboard. Comparable tools can demonstrate transferable thinking, but their product-specific features are not interchangeable.
Show who used the report and what they could do with it. “Built a weekly fulfilment report used by warehouse managers to investigate late dispatches” gives a purpose. Strengthen it with a real example of agreeing a metric, checking totals, handling refresh failures, collecting user feedback or training colleagues. Report counts and page counts are scope measures, not business impact by themselves.
7. Position Python or R at the right level
Include a language when it helps answer the vacancy’s requirements. Explain its use: pandas to compare files, R to analyse survey results, or a script to automate a repeated validation task. Name the relevant libraries selectively and distinguish exploratory notebooks from processes used routinely by colleagues.
The example describes Python as working knowledge and supports it with a specific file-checking task. It does not claim software engineering or machine-learning expertise. The vacancies we reviewed showed different expectations: a customer-facing technical analyst role required Python proficiency, while a revenue analytics role listed Python as desirable alongside a more central SQL and Looker requirement. Treat the actual advert as the guide.
If you use statistical methods, connect them to a question and explain what you checked. Comparing groups, analysing a time series or interpreting an experiment each calls for different reasoning. Only list methods you could defend in an interview, including their assumptions and limitations.
8. Show how you make data trustworthy
Replace a vague “data cleaning” claim with an example of the problem and your response. Useful evidence includes detecting duplicate identifiers, checking missing dates, standardising product codes, reconciling counts and values, and investigating unexplained changes after a refresh. Describe how you decided whether an unusual value was an error or a genuine event.
For recurring reporting, mention the controls that stopped problems returning: an exception report, a documented rule, a test, an agreed owner or a corrected upstream process. Alex’s duplicated-refund example demonstrates investigation and collaboration with the systems team, rather than a claim to have made every dataset error-free.
If the role uses sensitive information, describe relevant working practices accurately, such as restricting an extract to the fields needed or following an approved access process. Avoid broad claims that you “ensured compliance” unless that was genuinely your responsibility. The CV should demonstrate care with data through the work you did.
9. Connect the analysis to a recommendation
Describe communication as an analytical activity. Who needed an answer? How did you agree what the measure meant? What did you explain when the data could not support the original question? A short example of resolving conflicting definitions can be more useful than calling yourself an excellent communicator.
A practical sequence for an experience bullet is: investigated the problem, identified the relevant pattern, recommended an action, then measured or followed up the result. In Alex’s dispatch example, the analysis identifies where and when delays occur, and the recommendation changes an operational cut-off. The subsequent pilot supplies an observed result.
Be precise about ownership. An analyst may recommend a change while an operations manager approves and implements it. Use “recommended”, “informed” or “supported” where those verbs describe your contribution. If a proposal was not adopted, explain the useful finding or decision it supported without inventing implementation.
10. Quantify impact without overstating it
Use figures you can explain: preparation time before and after an improvement, the reporting period, the number of teams using a report, or the volume of exceptions resolved. Keep a private note of how you measured each claim so that you can answer follow-up questions. Do not include confidential underlying data in that note if you are not permitted to retain it.
Alex’s weekly pack falls from four hours to 90 minutes, a saving of two and a half hours per cycle. That is a direct process measure. It does not automatically equal a cash saving or justify multiplying it by every week of a year without checking actual use.
The late-dispatch rate falls from 8.4% to 6.9%, a reduction of 1.5 percentage points. It is not a 1.5% relative reduction. An interview-ready account would define “late”, give the eligible order count and comparison period, and discuss changes in order mix or seasonality. A before-and-after pilot alone does not establish that the recommendation caused the whole improvement. Claim an observed result at the appropriate scope.
If you cannot measure a business outcome, use an honest operational result: reconciled the report before the monthly review, identified the source of a discrepancy, or delivered an agreed metric definition. Do not invent a revenue figure to make a sound piece of work look impressive.
11. Present technical skills honestly
Group skills around tools and methods, with a short description of what you do. “SQL Server: joins, CTEs and aggregations for reporting” is easier to assess than a row of skill bars or a percentage rating. Where experience is limited, say “working knowledge”, “used in university project” or “currently learning”.
Keep the most relevant tools easy to find, then demonstrate the strongest ones in your work or projects. A reader should not discover ten claimed technologies with no evidence of their use. Conversely, you do not need a separate bullet for every function used in a single analysis. Include Git, testing or peer review when these are part of your practice; do not imply that saving a notebook locally is a collaborative development workflow.
12. Use a portfolio to make the work inspectable
A portfolio is particularly helpful when your paid work cannot be shared, your job title understates your analytical duties or you are entering the field. One or two carefully explained pieces can give a reviewer more evidence than a collection of unfinished notebooks. A GitHub repository suits SQL and code; a short written case study and a dashboard image may suit reporting work better.
Give each project a readable introduction covering the business question, dataset source and date, preparation decisions, checks, findings, limitations and how to reproduce the result. Link directly to your strongest project or a small index. Test the link without being signed in. Remove credentials, local file paths and any material you do not have permission to share.
Keep employer work private unless sharing is explicitly permitted. Power BI Publish to web makes content accessible without authentication, and Tableau Public workbooks and data are not private. Use an approved public dataset or a clearly labelled synthetic example. Removing a name or hiding a dashboard tab is not a reliable way to make confidential material safe to publish.
13. Select qualifications that support your application
Give the qualification, provider and completion date, with your degree classification where useful. A relevant degree can support your statistical or analytical foundation, but it does not replace evidence of applying those skills. New graduates can add a dissertation or a few relevant modules if they explain the work behind them.
Requirements differ. A technical analyst vacancy in our review specified a quantitative degree, while an analyst training programme welcomed varied academic backgrounds and career changers. An apprenticeship, work-based progression or demonstrable project experience may therefore be relevant, depending on the vacancy. Do not describe a degree as universally required or universally unnecessary.
For Power BI roles, Microsoft Certified: Power BI Data Analyst Associate is a relevant credential. State whether you have earned it, are studying for it or have booked the exam. Microsoft lists a 12-month renewal cycle, so check your actual credential status before calling it current. A course-completion certificate and a passed certification exam are different achievements; label them accurately.
14. Adjust the evidence for your career stage
For an entry-level applicant: put a short profile, evidenced technical skills, relevant projects and education near the beginning, followed by employment or volunteering. Keep previous work when it shows a useful foundation, such as checking stock records, investigating invoice discrepancies or explaining information to customers. Describe the real duties; do not rename every spreadsheet task as a Data Analyst role. Project results can be validation findings or a completed decision brief rather than commercial gains.
For an experienced analyst: give more space to recent work, the reporting or analytical areas you own, and what changed because of your contribution. Show increasing independence, more complex questions, user adoption or improved reliability. Senior vacancies may also need metric governance, mentoring or coordination with engineering, but only include these where you have done them.
In this two-page template, work history leads and the detailed skills section follows on page two. Keep your principal tools visible in the profile and recent role. For a first analyst application, moving a strong Projects or Skills section earlier may serve you better than preserving Alex’s section order exactly. Our graduate CV template offers another way to organise education and early-career evidence; keep the analytical project detail described here.
15. Check the CV as carefully as a report
Before sending it, check that every claimed tool has an honest level, every figure has a meaning and every project makes your contribution clear. Check dates against your employment history and remove skills you could not discuss. Read the CV aloud to catch sentences that list technology without explaining the work.
Replace the fictional contact details and portfolio address in this download. Keep substantial CV text editable and follow the employer’s requested file format. Open the final document after editing and inspect both pages, especially long project names and page breaks. If an application form extracts your details automatically, check the extracted fields rather than assuming the layout will be interpreted correctly.
You can also browse our full collection of free CV templates for other editable layouts.
FAQs
Check whether Tableau is essential from day one or one of several acceptable tools. Describe your Power BI work accurately and highlight transferable experience in modelling, metric definitions and dashboard usability. A completed Tableau project can demonstrate additional learning, but it does not turn Power BI employment experience into commercial Tableau experience. If the advert requires advanced Tableau development, make the gap clear.
You can use a target-role headline if it fairly describes the work you are seeking, but retain your official job titles in the employment history. An accurate clarification such as “MI Analyst (sales reporting)” can help. Let the bullets explain your analysis, SQL and stakeholder responsibilities. Inventing a promotion or replacing an administrative title with Data Analyst makes the employment record harder to verify.
Yes, if it demonstrates useful reasoning. Explain the question, what you checked and what the evidence could support. A well-run analysis might show that the available sample was too small to justify a rollout. Distinguish “we did not detect an effect” from “there is no effect”, and do not attach a cost-saving claim unless that saving was actually established.
Yes, when it is relevant and you can explain your own contribution. Describe how you checked generated work: reviewing joins and filters, testing edge cases and reconciling results. Do not present an AI-generated script as proof of expertise you cannot demonstrate. Follow the employer’s rules for any application exercise, including disclosure requirements, and never put confidential work data into an unapproved tool.
Usually the space is better used to explain the question, your contribution and the result, with a link to an accessible case study. A small screenshot rarely lets a recruiter inspect measures or data quality, and large images consume the two-page allowance. If an employer requests a visual sample, provide the requested format separately and include a short explanation of the data and design decisions.
Yes. Give the data period and make the purpose clear. A historical dataset can demonstrate SQL, validation and reporting, but it cannot establish today’s customer behaviour or market conditions. Discuss missing context, partial periods and how those limitations affect your recommendations. Updating the dashboard’s appearance does not make the underlying evidence current.
Follow the application instructions. Use the CV as an evidence bank, then address each essential criterion in the statement with a relevant example and your contribution. A public-service role may ask for experience with particular service data or statutory returns; a generic list of tools will not answer that. Supply the requested statement or form even if your CV contains similar information.
Check the exercise terms and obtain permission where needed. A test may contain confidential data, company questions or restrictions on sharing; completing it does not give you permission to publish it. If permission is unavailable, create a separate example using public or synthetic data and make its independent status clear. Do not reproduce the original test materials or another applicant’s solution.